
Red Agent Swarms for Testing Customer-Facing AI Agents
LLM applications have a semi-infinite attack surface, and they are notoriously hard to secure without breaking the user experience.
AI
LLM
AI Safety

Tagging resources in Databricks is essential for increasing observability across your environment. It enables deeper insights into cost attribution, job optimization, and detection of runaway clusters or workflows.
Databricks applies some basic tags to resources by default, such as the workspace name, the user or service principal executing the job, and the notebook path or job name associated with a cluster. These built-in tags can be helpful for small projects or limited teams.
As your usage grows — across more teams, projects, and environments — relying on default tags quickly becomes insufficient. A deliberate tagging strategy is critical not just for cost visibility, budgeting, and identifying long-running jobs, but also for automating operational tasks — like shutting down idle clusters — and enforcing business policies at scale.
While Databricks doesn’t offer a unified tagging system across all compute types out of the box, you can establish an effective custom tagging framework using a combination of platform tools and internal policies.
In this blog, we’ll walk through best practices for tagging compute resources in Databricks, and how to leverage those tags for monitoring, alerting, and cost optimization.
The ability to tag compute — and enforce those tags — depends on the type of resource in question. In many cases, tags must be added manually, and while tag keys are case-insensitive, tag values are not. Because of this, it’s important to enforce consistency wherever possible — either through Databricks-native tools or external business policies. Let’s explore how tagging works for the different types of compute options on the platform.
Tagging for serverless compute in Databricks is currently only possible via Budget Policies (currently in public preview). These can be found under the Workspace Settings -> Compute > Serverless budget policies section of the UI.
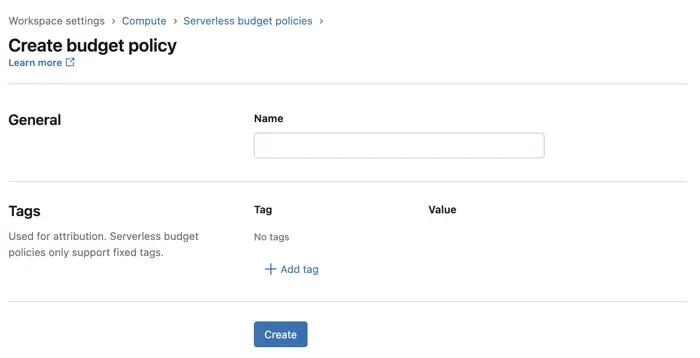
A budget policy defines a set of tag key-value pairs that are automatically applied to resources (e.g., notebooks, jobs, or pipelines) when a user operates within a serverless context. These policies are then assigned to users or groups, and any applicable resources they run inherit those tags.
There are important caveats to be aware of:
Because of this, many users may forget to set the appropriate billing policy — especially when multiple options are available. Rather than managing policies at the individual user level, it's more scalable to assign a single billing policy to each Databricks group, such as aligned with teams. This ensures users inherit the correct configuration automatically, especially for shared assets like notebooks and interactive clusters.
More information about budget policies can be found here: Budget policies documentation
SQL Warehouses can be started in three different flavors: Classic, Pro and Serverless. Serverless budget policies however are not applied to Serverless SQL Warehouses. Instead, tags must be manually configured. To add tags to a SQL Warehouse, expand the “Advanced Options” dropdown at the bottom of the configuration page before clicking “Create.”
In most organizations, SQL Warehouses tend to have less variation in usage patterns compared to all-purpose compute. For example, you might have a small number of shared warehouses used by analysts or BI tools, rather than dynamically spun-up compute for a wide range of pipelines and experiments. This stability makes it easier to implement centralized tagging strategies.
Classic and all-purpose clusters are the most flexible resources to tag in Databricks. Like SQL Warehouses, these clusters can be tagged at creation time, and users can be assigned pre-configured, pre-tagged clusters to simplify management.
Governance strategies like Databricks Compute Policies and AWS IAM enforcement work especially well for classic clusters because of their flexibility. Later on in this post, we will explore how to systematically enforce tagging with different Governance strategies.
Unlike clusters, jobs do not have enforcement mechanisms for tagging. Tags can be inherited from the compute resource used to run the job, but this alone may not provide sufficient granularity — especially when using serverless compute, where all jobs might share the same tags from a shared environment.
Adding tags directly to a job has practical benefits:
It’s also worth noting that while the job name itself is not a custom tag, it can serve as a lightweight tagging mechanism. Including structured naming conventions (e.g., project-team-purpose) allows for easier sorting, filtering, and parsing in downstream monitoring tools.
Because tagging enforcement is not available for jobs, organizations need to rely on process and automation. Strategies like using pre-configured workflow templates with pre-filled tags and adding CI/CD validation steps to check for required tags, can help maintain consistent tagging standards.
Now that we know how tags can be applied to Databricks resources, the next step is to enforce their consistent use. Governance tools like Asset Bundles, Terraform, and cluster policies help ensure tags are applied at creation time. In this section, we’ll cover how tags enable governance, auditing, and monitoring — including tracking usage, identifying missing tags, and optimizing spend through system tables, billing policies, and dashboards.
As Databricks usage grows, consistent tagging becomes critical for maintaining cost visibility, operational efficiency, and auditability. Strong governance ensures tags are applied systematically at resource creation, embedding consistency into the platform without relying on manual processes.
Infrastructure-as-code tools like Databricks Asset Bundles and Terraform allow you to define tags directly within deployment templates. For example, in an Asset Bundle YAML file, you can include a tags block that automatically applies team, environment, and project metadata when jobs or workflows are deployed:
resources:
  jobs:
    my_job:
      name: example-job
      tags:
        team: data-engineering
        env: production
        project: event-ingestion
      tasks:
        - task_key: example_task
          notebook_task:
            notebook_path: /Repos/path/to/notebook
For classic and all-purpose clusters, Databricks Compute Policies offer a flexible way to enforce tagging at the compute level. Policies can control parameters like node_type and max_workers, but also enforce specific tag keys and constrain allowed tag values. For example, a compute policy might require a Team tag and limit its values to data scientist or data engineer:
{
  "custom_tags.Team": {
    "type": "allowlist",
    "values": ["data scientist", "data engineer"]
  }
}
For AWS-backed workspaces, you can extend tag enforcement beyond Databricks by applying IAM conditions at the EC2 level. This adds an additional layer of control, ensuring that even if users bypass Databricks compute policies, cluster creation still requires the correct tags.
To mirror the compute policy example shown earlier, you can add the following condition to your IAM policy:
"Condition": {
  "StringNotEqualsIgnoreCase": {
    "aws:RequestTag/Team": ["data engineer", "data scientist"]
  }
}
If you simply want to ensure that the Team tag is present, regardless of value, you can instead use:
{
  "Condition": {
    "StringNotLike": {
      "aws:RequestTag/Team": "?*"
    }
  }
}
These IAM conditions apply when launching EC2 instances, so any attempt to spin up untagged or incorrectly tagged clusters will result in a failure.
Technical controls like compute policies and IAM enforcement work best when combined with process-driven safeguards. Pre-tagged workflow templates and CI/CD checks help catch issues early, ensuring consistency even in flexible environments. By embedding tagging into templates, policies, and pipelines, organizations can scale with governance built in from the start.
System Tables
System tables provide a centralized, queryable view of your Databricks workspace activity. They contain operational metadata such as query history, job executions, cluster activity, billable usage, and resource runtime, giving you deep insight into how your workspace is being used.
With system tables, you can:
When you apply custom tags to jobs, clusters, or other resources, they appear in the custom_tags column of the relevant system table — for example, in system.compute.clusters or system.job.job_runs.
System tables are read-only, so while you can’t add or update tags through them, you can use queries to identify untagged or mis-tagged resources. These queries can be integrated into dashboards or SQL alerts to regularly flag issues and help ensure tagging compliance across teams.
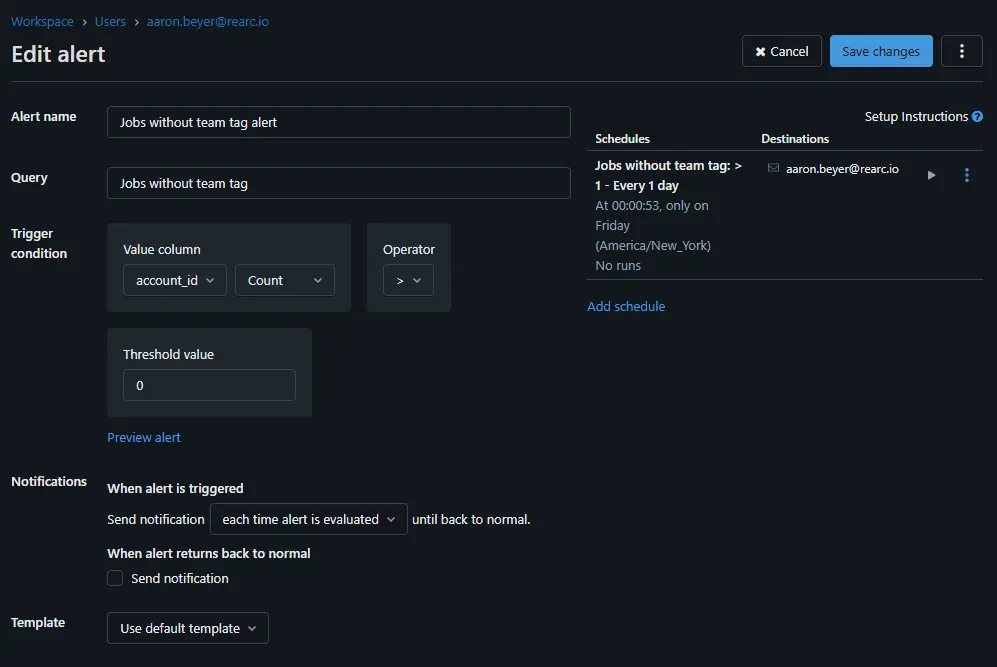
For example, the following query returns all jobs that are missing a team tag:
SELECT *
FROM system.workflow.jobs
WHERE NOT map_contains_key(tags, 'team');
Once you've written your query in the SQL editor, you can save it and create an alert under the “Alerts” tab. This allows you to receive automated email notifications when certain conditions are met — such as jobs missing the team tag. The example alert shown below runs every Friday and sends an email if at least one job is found without the required team tag.
While the billing and compute schemas are enabled by default, most other system tables — such as those under system.workflow , and system.query — need to be manually enabled. For setup instructions and a full list of available system tables and their contents, refer to the official documentation: System tables documentation.
Budgets
Currently in public preview, Budgets in Databricks let you track usage by tag, budget policy, and workspace. You can monitor the current month’s spend, remaining budget, and daily usage trends — making it easy to view spend by team, project, or environment based on your tagging strategy.
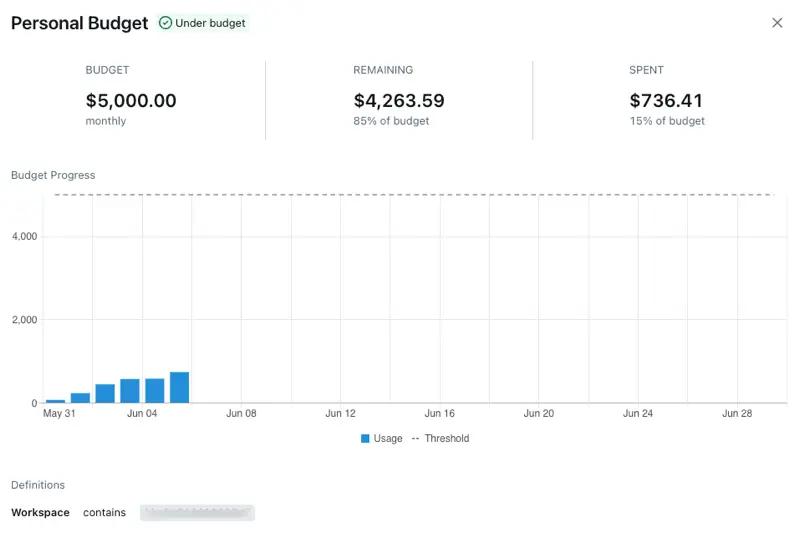
In addition to visibility, budgets support email notifications when spending thresholds are met. This gives you a way to proactively respond to unexpected usage — whether by scaling down underutilized resources or enforcing stricter controls. Email alerts can be sent to anyone, regardless of whether they have a Databricks account, making it easy to involve finance or business stakeholders in spend monitoring without needing to onboard them into the platform.
Usage Dashboard
The Usage Dashboard, built on system tables, lets account administrators monitor costs across Databricks services at the workspace or account level. It updates in near real-time and provides interactive visualizations that can be filtered by custom tags.
For example, if you're running a cybersecurity use case and have tagged jobs based on log source, the dashboard allows you to break down usage and costs by those tags — giving you insight into which sources are generating the most spend:
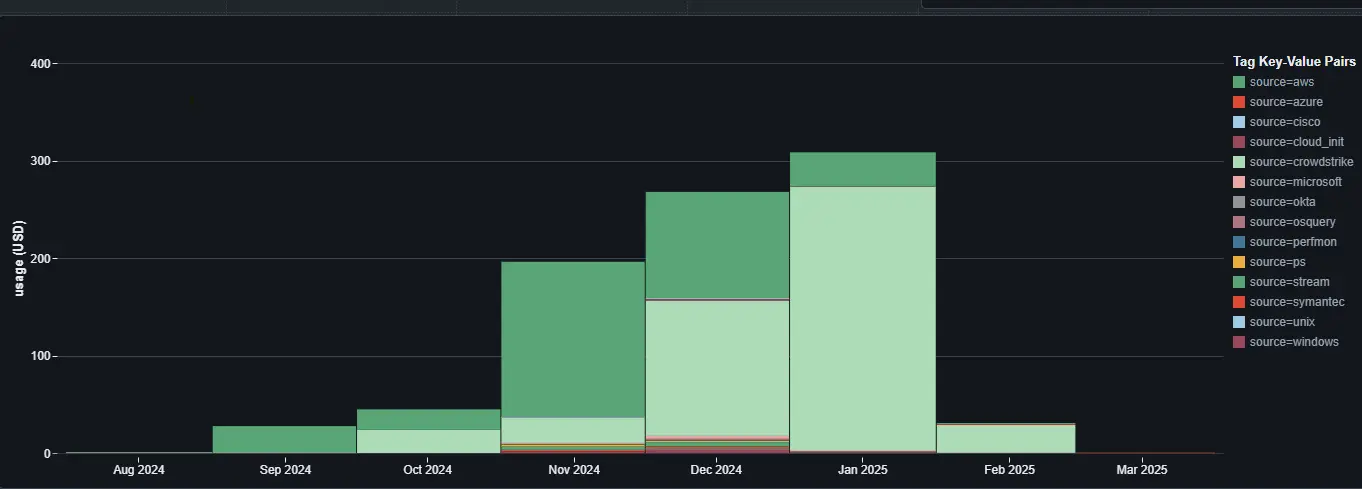
You can also filter the dashboard by date range (days, weeks, or months) to track spend over time, and adjust parameters to drill into specific projects, teams, or services.
While Databricks provides a rich set of out-of-the-box visuals, you can also create custom dashboards using system tables directly. This allows you to track the exact KPIs or usage patterns that matter to your organization — whether that’s cost per tag, idle compute time, or the number of jobs run per environment.
Tagging in Databricks is a simple but effective way to improve visibility, manage costs, and keep your environment organized. While the platform doesn’t enforce tags across all resource types, features like compute policies, billing policies, and system tables make it possible to build a consistent tagging approach.
Once tags are in place, tools like budgets, system tables, and the usage dashboard help you track usage, catch missing tags, and better understand how resources are being used.
Read more about the latest and greatest work Rearc has been up to.
LLM applications have a semi-infinite attack surface, and they are notoriously hard to secure without breaking the user experience.

Recently, articles surrounding the supposed dangers of an open source abliteration tool called Heretic, along with legal notice being served to its creator, have inspired me to speak out for two reasons.
A step-by-step guide to deploying a Databricks workspace with Private Service Connect (PSC) on GCP and common pitfalls to avoid.

A deep dive into Databricks Foreign Catalogs for Glue Iceberg table access
Tell us more about your custom needs.
We’ll get back to you, really fast
We will evaluate your query and respond within 2 business days.
Kick-off meeting
We will schedule a quick meeting to further understand your use case and start working toward a solution together!