San Francisco Property Risk Analysis with Databricks

What if sentiment analysis, locally relevant economic metrics, reports of closing businesses, and more could be utilized, not just to remind us of an uncertain industry, but to help property owners make better decisions about their commercial properties and tenants?

Get In Touch With RearcCheck Out the Blog Post
Databricks logo

What We Built

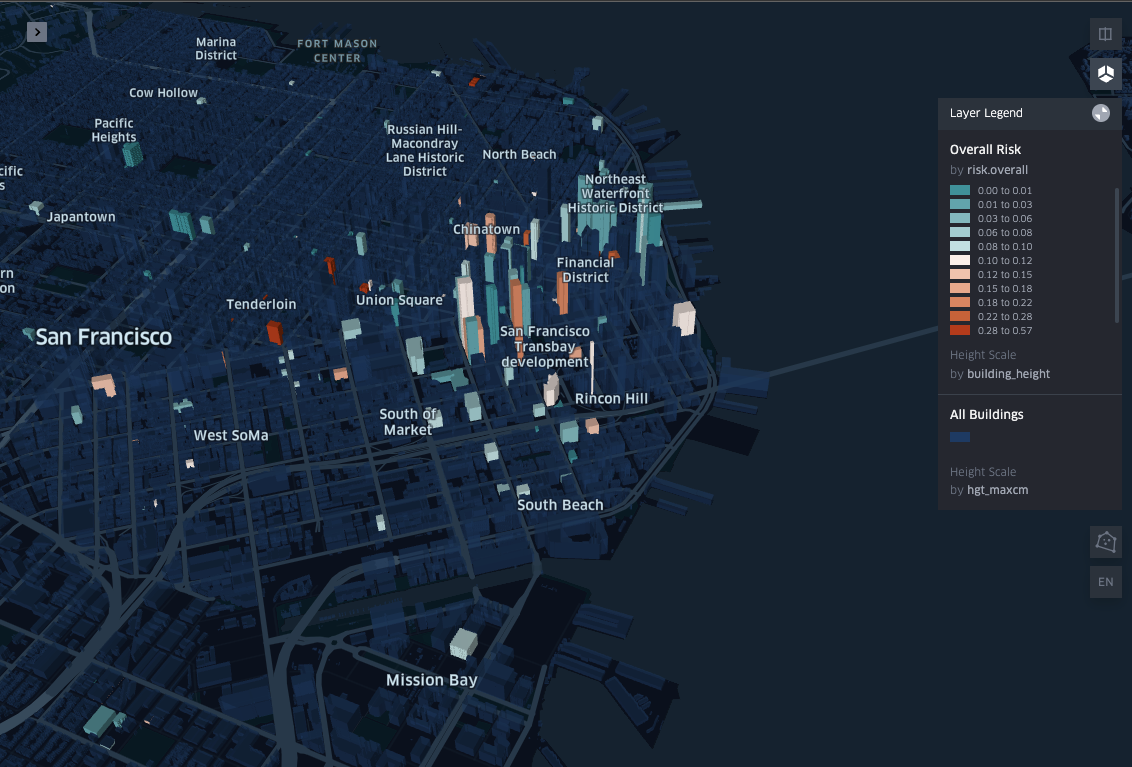
The results of our analysis are presented below. Here you can interact with a selection of properties across San Francisco. If you hover over the graphic, you’ll find an assortment of descriptive information, including the property’s address, the name of the business that occupies the property, and risk scores computed according to each of the following categories:

  • Financial Risk: Assessing the tenant’s financial well-being as well as broader economic factors such as interest rates, GDP growth, and sector employment trends.
  • Sentiment Risk: Evaluating sentiment and perception related to the property and tenant.
  • Geographic Risk: Considering geography-specific risks like local crime, as well as weather events, earthquakes, etc.
  • Tenant/Site Risk: Analyzing tenant history, including payment reliability and tenure.
  • Overall Risk: A weighted composite score of the above metrics.

Each of these risk scores falls between 0 and 1, where the risk score is intended to communicate the likelihood that a given tenant/property will default. The higher-risk properties are indicated by a darker shade of red, while relatively safe properties are represented with green, with varying shades of yellow covering the properties in between.

You can find a full-screen visualization, complete with San Francisco building footprints, at Rearc’s website. It may take a minute or two to load.

Contact Us / Get The SlidesCheck Out the Blog Post

Obtaining the Data

The Rearc Data team has a robust data platform built on top of Apache Airflow which we have used in collaboration with multiple partners to deliver a variety of complex data requests over the years, and we were already sourcing and publishing data from the BLS, BEA, and Federal Reserve.

The San Francisco Government Open Data project makes their data easy to access and we were able to ingest it through our data platform.

GDELT is a very large dataset (more than 8 trillion datapoints!) that indexes almost every news item in the world. This would be quite difficult to source using standard methods, but the data can be found and accessed via the Databricks Marketplace.

For context, Databricks is a unified analytics platform that integrates Apache Spark and provides collaborative tools for processing and analyzing large-scale data. In addition, the Databricks Marketplace includes a wide assortment of datasets to add to our analysis. Because we have existing pipelines that publish our data to Databricks, this tool is a natural choice for the data collection phase of our project. By pulling data from Rearc’s data catalog using the Marketplace and Delta Sharing, we gain seamless access to diverse and up-to-date data sources, greatly accelerating our analysis.

Generating Risk Scores using Databricks

The goal in this analysis is show how Databricks and Delta Sharing can help estimate a property risk score, in this case a value that represents the likelihood of a given tenant and/or property experiencing default within the next 12 months. With this score, we want to provide property owners with valuable insights to inform their decision-making processes. Because we are already using Databricks to centralize all of our data, we decided to continue to use its capabilities (particularly notebooks, Spark, and SQL) to generate the risk scores, and we will walk through the process below.

Incorporating Historical Features

Historical features such as interest rates, GDP growth, and others were crucial in our risk analysis. To incorporate trends, we utilized a combination of aggregation and time-series methods, allowing us to capture important historical patterns and their potential impact on property risk.

Handling GDELT Data

GDELT, a large-scale dataset, presented challenges due to its size. However, utilizing Databricks’ capabilities, we were able to process the GDELT data and extract valuable insights. Additionally, we created two sentiment scores: visibility (measuring the level of recognition for a company on a scale of 0 to 1) and perception (evaluating the positive or negative perception of a company).

Scaling and Harmonizing Data

To ensure consistency across different risk categories and datasets, we applied scaling and harmonization techniques. These methods allowed us to normalize and standardize the data, facilitating a comprehensive assessment of property risk.

Conclusion

By harnessing the capabilities of the Rearc Data Platform, Databricks, and Delta Sharing, we can provide property owners and investors in San Francisco with the tools they need to make informed decisions. Our data-driven risk analysis facilitates proactive risk management and enables individuals to navigate the rental property market with confidence.

Interested In Learning More? Contact Us!

Please specify below subject for your inquiry. We will address it as soon as possible!